
Global Chocolate Sales & Revenue Analysis
Analyzed a comprehensive dataset of global sales transactions to identify cyclical trends, top-performing products, and optimize pricing strategies based on volume-to-revenue correlation. Raw data was cleaned, validated, and visualized into a dynamic dashboard in Python.
Business Objective
The objective was to transform raw transaction text into actionable business intelligence. We sought to understand which SKUs drive the highest margins, identify geographic growth opportunities, and validate if volume metrics (Boxes Shipped) linearly correlate with total financial income ($ Amount) or if pricing inconsistencies exist.
Data Analytics Stack
- • Python (Language)
- • Pandas (Data Cleaning & Aggregation)
- • Matplotlib (Visualization Engineering)
- • Google Colab (Development Environment)
Preprocessing & Data Hygiene
The raw dataset was heavily validated and sanitized to ensure financial accuracy. Critical steps included stripping non-numeric currency symbols (e.g., converting `$5,320` to `5320.0`) and coercing string formats into strictly typed datetime objects (e.g., `04-Jan-22`) using Python. This foundational step ensured aggregated calculations (like total revenue) were mathematically precise.
Analytical Insights Dashboard
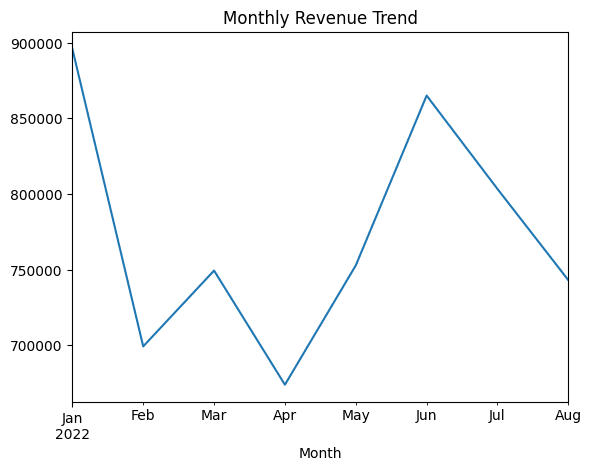
Monthly Revenue Trend: Linear regression applied to aggregated monthly transaction data, revealing cyclical sales volume.